PanelAgent
Live log
The Live tab shows the log of the agent the moment the agent writes it: the cycles of the monitor, the work of the executor, the warnings and the errors.
Step 1: Open the log
Click the Live tab. The Pretty logs view shows each session as a conversation: the start of the session, the messages and the thinking of the agent, the tool calls with a result you can expand, the changes of state of the monitor and the executor, and the end of the session with its cost and number of turns. New entries show up as they arrive, and when the connection drops, the panel reconnects by itself.
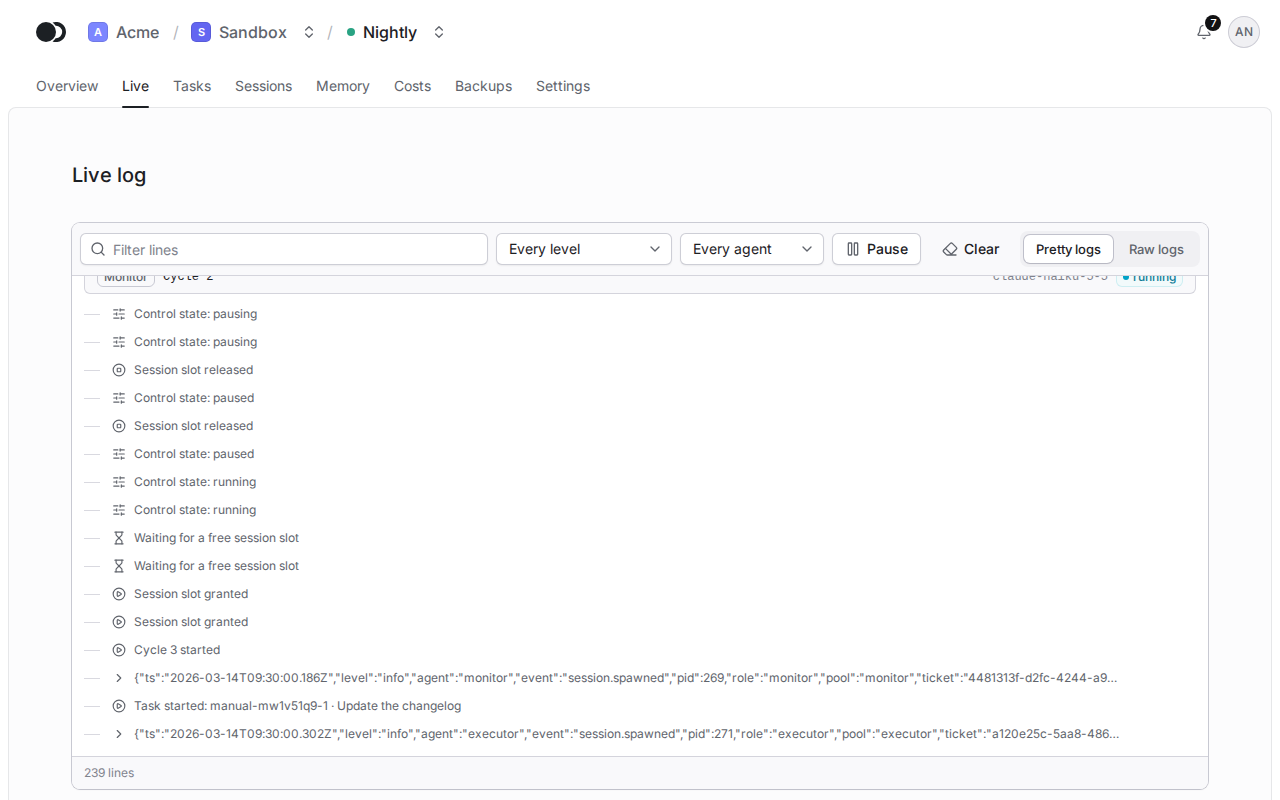
Step 2: Filter the lines
Type text into Filter lines, or pick a Level, for example Warnings and errors, and the Agent whose lines you want to see. The filter works in both views of the log.
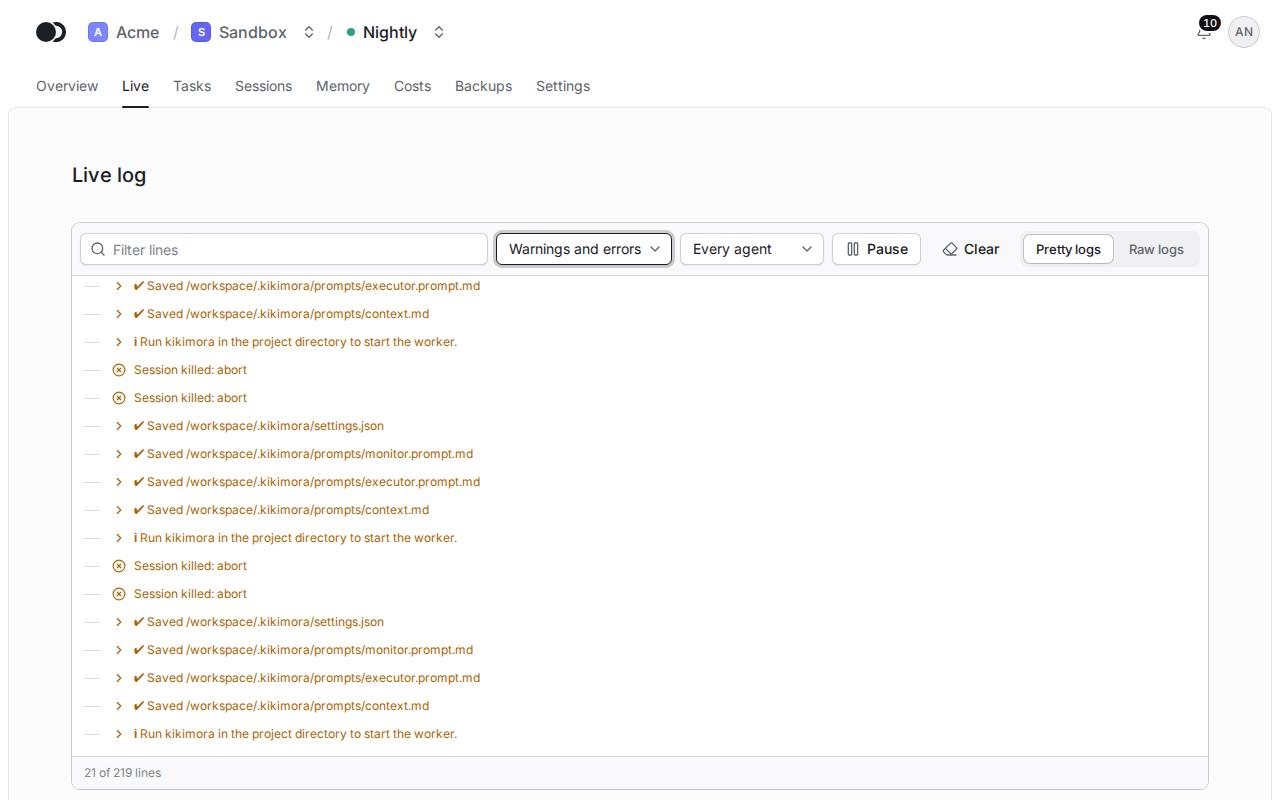
Step 3: Switch to the raw logs
Click Raw logs in the Log view switch on the right of the bar. Each line of the log then stands on its own, with its time, level and agent, and you click a long line to see the whole of it. Pretty logs brings the conversation back. The browser remembers the view you chose, in the transcript of a session too.
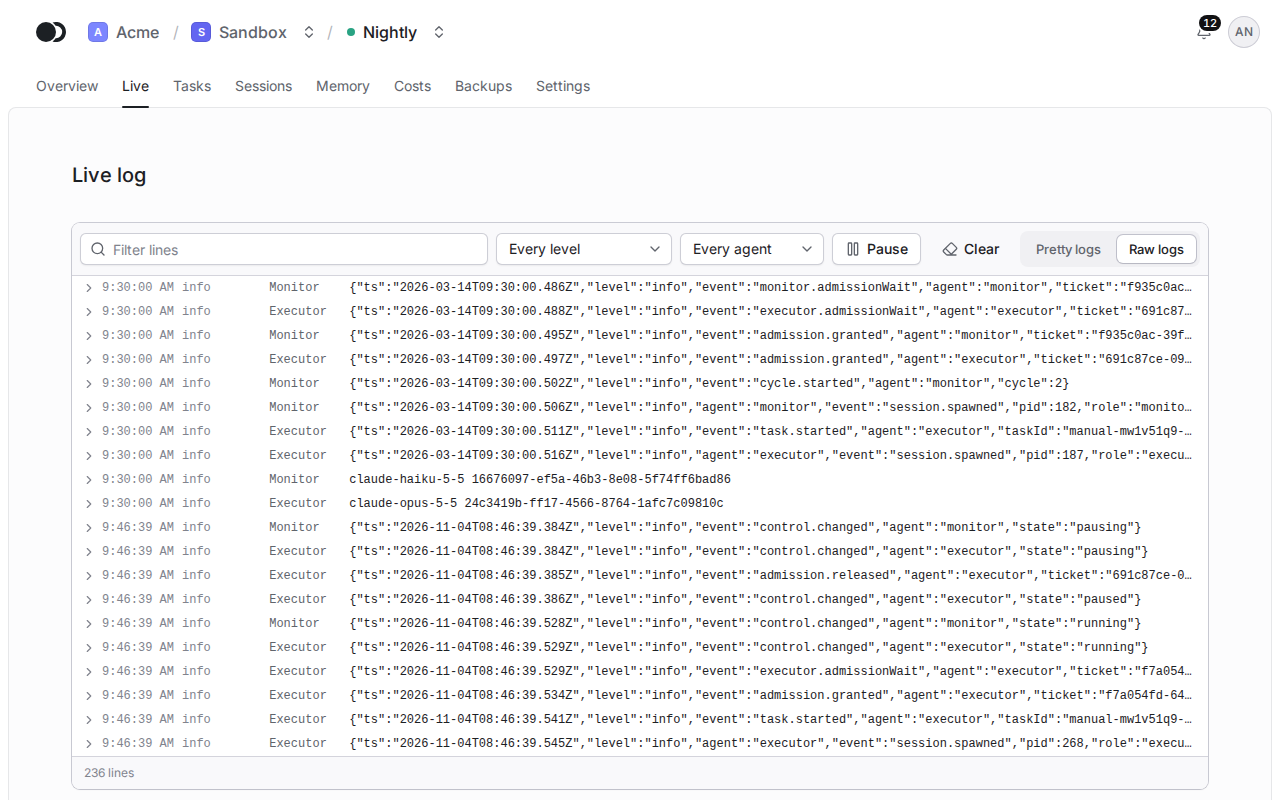
The Pause and Clear buttons on the bar of the log act on the view alone: Pause holds the new lines back, Resume lets them in again, and Clear empties the view. The agent keeps working meanwhile. You read earlier lines with kcloud agents logs.
Matches the panel at cloud.kikimora.dev.